Question 1:
moderate
The v-t graph for a particle is as shown. The distance travelled in the first four second is
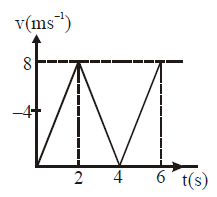
Area bounded by v-t graph represents displacement. Here.
Area = (1/2)×4×8= 16
So, Distance travelled is 16 m.