Question 1:
difficult
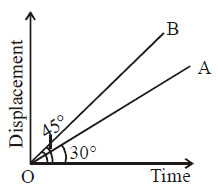
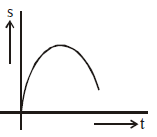
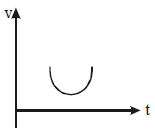
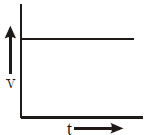
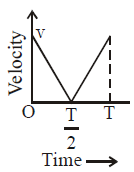
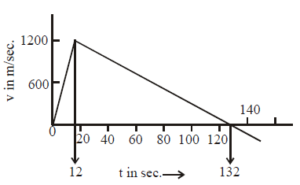
The given graph shows the variation of velocity with which one of the graph given below correctly represents the variation of acceleration with displacement :
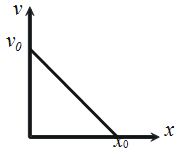
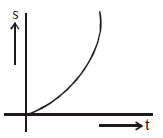
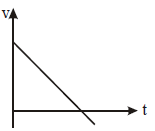
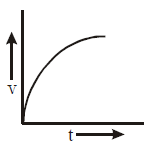
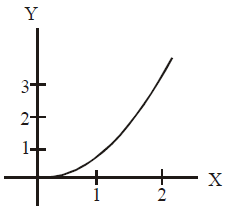
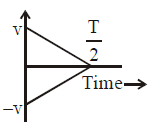
1. 
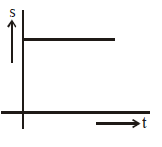
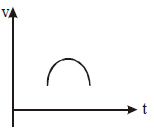
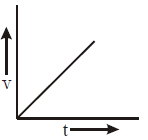
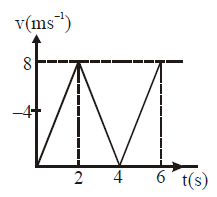
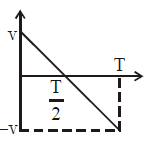
2. 
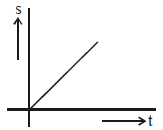
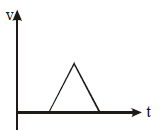
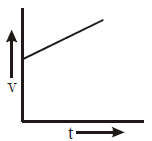
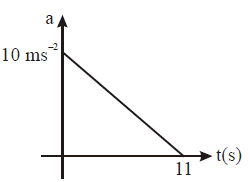
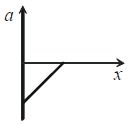
3. 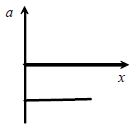
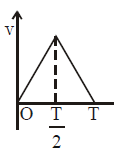
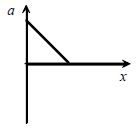
4. 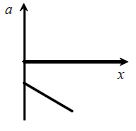
\[ a= v \frac{dv}{ds} \]