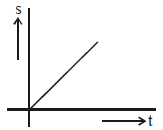
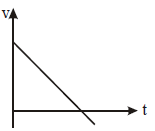
The displacement-time graph of two moving particles A and B respectively make angles of 30° and 45° with the x-axis respectively. The ratio of their velocities is
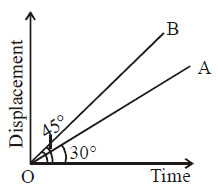
1. 1 : √3
2. 1 : 2
3. 1 : 1
4. √3 : 2
View Answer
Slope of displacement time graph represents velocity.
VA= tan 30 0
VB= tan 45 0
So, VA/VB=tan 30 0/tan 45 0= 1/√3
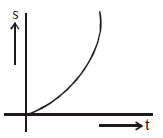
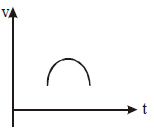
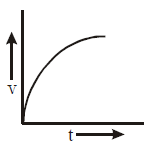
If the figure below represents a parabola, identify the physical quantities representing Y and X for constant acceleration
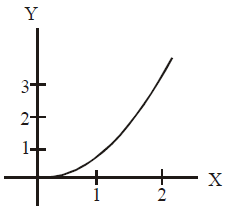
1. X = time, Y = velocity
2. X = velocity, Y = time
3. X = time, Y = displacement
4. X = time, Y = acceleration
View Answer
\[ S= \frac{1}{2}at^{2}\]
As, S is proportional to t graph is a parabola
A car moving with a speed of 50 km h–¹ can be stopped by brakes after atleast 6m. If the same car is moving at a speed of 100 km h–¹ the minimum stopping distance is :
1. 6 m
2. 12 m
3. 18 m
4. 24 m
View Answer
The stopping distance is proportional to the square of the speed:
\[
\frac{s_2}{s_1} = \left( \frac{v_2}{v_1} \right)^2
\]
Substituting the values:
\[
\frac{s_2}{6} = \left( \frac{100}{50} \right)^2 = 2^2 = 4
\]
\[
s_2 = 6 \times 4 = 24 \, \text{m}
\]
Thus, the minimum stopping distance at 100 km/h is 24 meters.
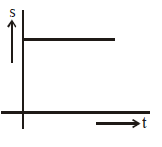
Assertion (A): For uniformly accelerated motion along straight line, the position versus time graph is a straight line.
Reason (R): For uniformly accelerated motion the position in equal intervals of time changes by same amount.
1. (1) Both (A) & (R) are true and the (R) is the correct explanation of the (A)
2. (2) Both (A) & (R) are true but the (R) is not the correct explanation of the (A)
3. (3) (A) is true but (R) is false
4. (4) Both (A) and (R) are false
View Answer
Assertion (A) is false.
For uniformly accelerated motion, position \( x \) is related to time \( t \) by \( x = x_0 + v_0 t + \frac{1}{2} a t^2 \). This is a parabolic equation, so the position-time graph is a parabola, not a straight line.
Reason (R) is false. In uniformly accelerated motion, velocity changes by equal amounts in equal time intervals, but position does not. Position changes by increasing amounts (if starting from rest).
Therefore, both the Assertion and the Reason are false.
Assertion (A): In one dimensional motion, area under velocity-time graph gives change in position i.e., displacement.
Reason (R): In one dimensional motion, area under acceleration-time graph gives final velocity.
1. Both (A) & (R) are true and the (R) is the correct explanation of the (A)
2. Both (A) & (R) are true but the (R) is not the correct explanation of the (A)
3. (A) is true but (R) is false
4. Both (A) and (R) are false
View Answer
Area under v-t graph = displacement; Area under a-t graph = change in velocity.
Solution: (A) is true as area under v-t graph is displacement. (R) is false as area under a-t graph gives change in velocity, not final velocity. So, (A) is true and (R) is false.