Question 1:
easy
A car moves from X to Y with a uniform speed \[v_{u}\] and returns to X with a uniform speed \[v_{d}\]. The average speed for this round trip is
A car moves from X to Y with a uniform speed \[v_{u}\] and returns to X with a uniform speed \[v_{d}\]. The average speed for this round trip is
The velocity of a body of mass 20 kg decreases from 20 ms–¹ to 5 ms–¹ in a distance of 100 m. Force on the body is
We can use the work-energy principle to find the force.
Given:
- Initial velocity, \( u = 20 \, \text{m/s} \)
- Final velocity, \( v = 5 \, \text{m/s} \)
- Distance, \( s = 100 \, \text{m} \)
- Mass, \( m = 20 \, \text{kg} \)
Using the equation of motion:
\[
v^2 = u^2 + 2as
\]
\[
(5)^2 = (20)^2 + 2a(100)
\]
\[
25 = 400 + 200a
\]
\[
200a = -375 ;a = -\frac{375}{200} = -1.875 \, \text{m/s}^2
\]
Now, force \( F = ma \):
\[
F = 20 \times (-1.875) = -37.5 \, \text{N}
\]
Thus, the force on the body is -37.5 N (opposite to the direction of motion).
The displacement-time graph of two moving particles A and B respectively make angles of 30° and 45° with the x-axis respectively. The ratio of their velocities is
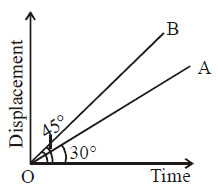
Slope of displacement time graph represents velocity.
VA= tan 30 0
VB= tan 45 0
So, VA/VB=tan 30 0/tan 45 0= 1/√3
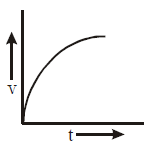
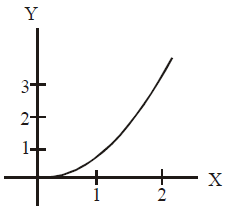
A body is travelling in a straight line with a uniformly increasing speed. Which one of the plot represents the change in distance (s) travelled with time (t)?
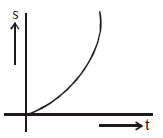
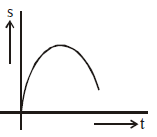
\[ s= \frac{1}{2}at^{2}\]
As s is proportional to square of t. s-t graph is a parabola.
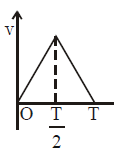
A particle is thrown upwards, then correct v-t graph will be
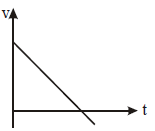
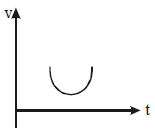
Slope of v-t graph represent acceleration. when object is thrown upward its acceleration is -g for the entire journey. So, slope is -g.
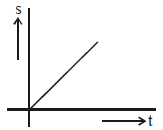
A body starts from rest and moves with uniform acceleration. Which of the following graphs represents it motion?
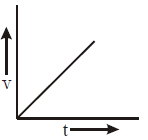
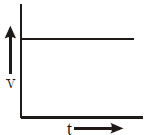
\[ v = u + at ; as, u = 0 ; v = at\]
As, v is proportional to t ; graph of v-t is a straight line.
If the figure below represents a parabola, identify the physical quantities representing Y and X for constant acceleration
Two bodies of different masses \[m_{a} and m_{b}\] are dropped from two different heights, viz, a and b. The ratio of time taken by the two to drop through these distances is :
The time taken by an object to fall from a height is given by the equation:
\[
t = \sqrt{\frac{2h}{g}}
\]
For mass \( m_a \) dropped from height \( a \), the time taken is:
\[
t_a = \sqrt{\frac{2a}{g}}
\]
For mass \( m_b \) dropped from height \( b \), the time taken is:
\[
t_b = \sqrt{\frac{2b}{g}}
\]
The ratio of time taken by the two bodies is:
\[
\frac{t_a}{t_b} = \frac{\sqrt{\frac{2a}{g}}}{\sqrt{\frac{2b}{g}}} = \sqrt{\frac{a}{b}}
\]
So, the ratio of the time taken is:
\[
\frac{t_a}{t_b} = \sqrt{\frac{a}{b}}
\]
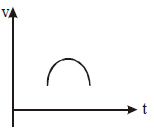
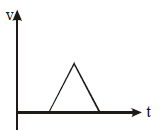
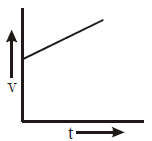
A particle is thrown vertically upwards with a velocity ν. It returns to the ground in time T. Which of the following graphs correctly represents the motion?
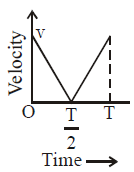
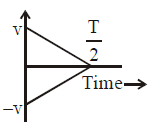
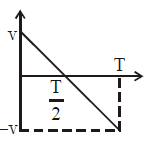
Graph of velocity time graph represents acceleration. During the entire journey acceleration is -g. so slope is negative.
Velocity versus time graph for a body projected vertically upwards is :-