Question 1:
moderate
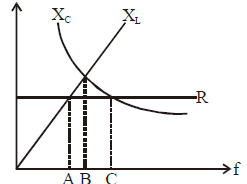
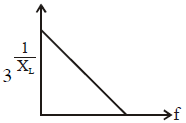
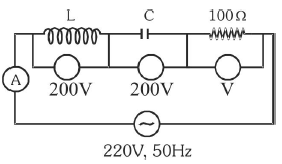
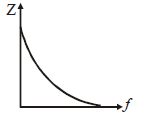
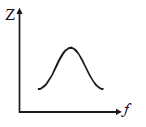
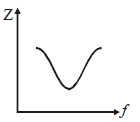
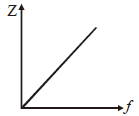
The figure shows variation of R, XL and XC with frequency f in a series L, C, R circuit. Then for
what frequency point, the circuit is inductive ?