A car moving with a speed of 50 km h–¹ can be stopped by brakes after atleast 6m. If the same car is moving at a speed of 100 km h–¹ the minimum stopping distance is :
1. 6 m
2. 12 m
3. 18 m
4. 24 m
View Answer
The stopping distance is proportional to the square of the speed:
\[
\frac{s_2}{s_1} = \left( \frac{v_2}{v_1} \right)^2
\]
Substituting the values:
\[
\frac{s_2}{6} = \left( \frac{100}{50} \right)^2 = 2^2 = 4
\]
\[
s_2 = 6 \times 4 = 24 \, \text{m}
\]
Thus, the minimum stopping distance at 100 km/h is 24 meters.
The position-time (x-t) graphs for two children A and B returning from their school O to their homes P and Q respectively are as shown in the figure. Choose the incorrect statement regarding these graphs :
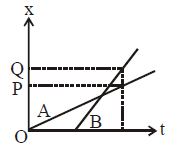
1. A lives closer to the school than B
2. A starts from the school earlier than B
3. A walks faster than B
4. A and B reach home at the same time
View Answer
Slope of x-t graph represents velocity. slope is more for B so it will have higher velocity
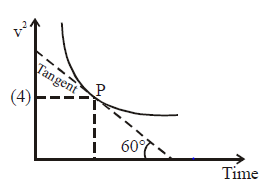
Between two stations a train first accelerates uniformly, then moves with uniform speed and finally retards uniformly. If the ratios of the time taken for acceleration, uniform speed and retarded motions are \(1 : 8 : 1\) and the maximum speed of the train is \(60\text{ km/hr}\), the average speed of the train over the whole journey is:
1. 25 km/hr
2. 54 km/hr
3. 40 km/hr
4. 50 km/hr
View Answer
Let the time intervals be \(t\), \(8t\), and \(t\). Total time is \(10t\). Total distance is the area under the v-t graph: \(S = \frac{1}{2} (8t + 10t) v_{\text{max}} = 9t v_{\text{max}}\). Average speed is \(v_{\text{avg}} = \frac{9t v_{\text{max}}}{10t} = 0.9 v_{\text{max}} = 0.9 \times 60 = 54\text{ km/hr}\).
Assertion (A): For a moving particle on a straight line magnitude of average velocity between any two points will be less than magnitude of instantaneous velocity at every point between them.
Reason (R): In \(x-t\) graph slope of chord joining two points gives average velocity between them.
1. Both (A) & (R) are true and the (R) is the correct explanation of the (A)
2. Both (A) & (R) are true but the (R) is not the correct explanation of the (A)
3. (A) is true but (R) is false
4. Both (A) and (R) are false
View Answer
Assertion (A) is false. The magnitude of average velocity can be equal to or greater than the magnitude of instantaneous velocity at some points, or less than at others. For constant velocity, they are equal.
Reason (R) is true. By definition, the slope of the chord in an \(x-t\) graph represents the average velocity. However, since Assertion (A) is false, option (4) is selected.
Assertion (A): For uniformly accelerated motion along straight line, the position versus time graph is a straight line.
Reason (R): For uniformly accelerated motion the position in equal intervals of time changes by same amount.
1. (1) Both (A) & (R) are true and the (R) is the correct explanation of the (A)
2. (2) Both (A) & (R) are true but the (R) is not the correct explanation of the (A)
3. (3) (A) is true but (R) is false
4. (4) Both (A) and (R) are false
View Answer
Assertion (A) is false.
For uniformly accelerated motion, position \( x \) is related to time \( t \) by \( x = x_0 + v_0 t + \frac{1}{2} a t^2 \). This is a parabolic equation, so the position-time graph is a parabola, not a straight line.
Reason (R) is false. In uniformly accelerated motion, velocity changes by equal amounts in equal time intervals, but position does not. Position changes by increasing amounts (if starting from rest).
Therefore, both the Assertion and the Reason are false.
Assertion (A): In one dimensional motion, area under velocity-time graph gives change in position i.e., displacement.
Reason (R): In one dimensional motion, area under acceleration-time graph gives final velocity.
1. Both (A) & (R) are true and the (R) is the correct explanation of the (A)
2. Both (A) & (R) are true but the (R) is not the correct explanation of the (A)
3. (A) is true but (R) is false
4. Both (A) and (R) are false
View Answer
Area under v-t graph = displacement; Area under a-t graph = change in velocity.
Solution: (A) is true as area under v-t graph is displacement. (R) is false as area under a-t graph gives change in velocity, not final velocity. So, (A) is true and (R) is false.
Assertion (A): For motion from rest with constant acceleration distance time graph is a parabola, always with increasing slope.
Reason (R): Speed of the body starting from rest with constant acceleration always increases linearly with time.
1. Both (A) & (R) are true and the (R) is the correct explanation of the (A)
2. Both (A) & (R) are true but the (R) is not the correct explanation of the (A)
3. (A) is true but (R) is false
4. Both (A) and (R) are false
View Answer
Formula: For (u=0), \(s = \frac{1}{2}at^2\) and (v = at).
Solution: (A) is true; \(s = \frac{1}{2}at^2\) is a parabola, and its slope (velocity (v=at)) increases with time. (R) is true; (v=at) shows speed increases linearly from rest. (R) correctly explains (A) because the linearly increasing speed implies an increasing slope for the distance-time graph.
Assertion (A): Trajectory of an object moving under a constant acceleration must be a straight line.
Reason (R): The shape of trajectory depends only on the acceleration.
1. Both (A) & (R) are true and the (R) is the correct explanation of the (A)
2. Both (A) & (R) are true but the (R) is not the correct explanation of the (A)
3. (A) is true but (R) is false
4. Both (A) and (R) are false
View Answer
Assertion (A) is false; under constant acceleration, the trajectory can be a parabola (projectile motion) or a straight line depending on initial velocity. Reason (R) is false; the trajectory's shape depends on both initial velocity and acceleration.