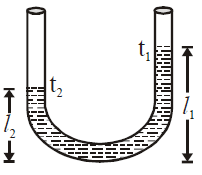
In a vertical U-tube containing a liquid, the two arms are maintained at different temperatures t1 and t2 . The liquid columns in the two arms have heights l1 and l2 respectively. The coefficient of volume expansion of the liquid is equal to
For a liquid in a U-tube with different temperatures in each arm, the expansion of the liquid in each arm is affected by the temperature difference.
Let:
- \( l_1 \) and \( l_2 \) be the heights of the liquid columns at temperatures \( t_1 \) and \( t_2 \), respectively.
- \( \beta \) be the coefficient of volume expansion of the liquid.
Since the pressure at the same horizontal level in both arms must be equal, we have:
\[
l_1 (1 + \beta t_1) = l_2 (1 + \beta t_2)
\]
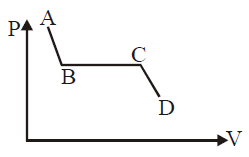
The portion AB of the indicator diagram representing the state of matter denotes :
If the portion AB is slant, it indicates that both pressure (P) and volume (V) are changing. In thermodynamic terms, this suggests that AB could represent a compression or expansion, process where both pressure decreases and volume decreases.
Given that you mentioned that the correct answer is "the liquid state of matter," it is likely that AB represents the compression of a liquid.
In many thermodynamic diagrams, when a liquid is compressed or expands slightly, both its pressure and volume can change, though not as dramatically as in gases. This phase corresponds to the liquid region of a substance's phase diagram, where both pressure and volume are decreasing, which is why AB represents the liquid state.
To summarize:
- AB is slant: Both pressure and volume are decreasing.
- Liquid state: Liquids are not perfectly incompressible; hence, both pressure and volume can change, but the changes in volume are relatively small compared to gases.
This slant line indicates the behaviour of a liquid as it is compressed, leading to the conclusion that AB represents the liquid state of matter.
At room temperature, the r.m.s. speed of the molecules of certain diatomic gas is found to be 1930 m/s. The gas is :
The root mean square (r.m.s.) speed \( v_{\text{rms}} \) of gas molecules is given by the formula:
\[
v_{\text{rms}} = \sqrt{\frac{3 k_B T}{m}}
\]
where:
- \( k_B \) is the Boltzmann constant,
- \( T \) is the temperature (assumed to be room temperature here),
- \( m \) is the mass of one molecule of the gas.
Rearranging to find \( m \):
\[
m = \frac{3 k_B T}{v_{\text{rms}}^2}
\]
For a diatomic gas like \( \text{H}_2 \), using the given \( v_{\text{rms}} = 1930 \, \text{m/s} \), we calculate that this speed corresponds to the molecular mass of hydrogen (\( \text{H}_2 \)). Therefore, the gas is identified as \( \text{H}_2 \).
The pressure and temperature of two different gases is P and T having the volume V for each. They are mixed keeping the same volume and temperature, the pressure of the mixture will be :
Since the gases are mixed at constant volume \( V \) and temperature \( T \), we can apply the ideal gas law for each gas:
For each gas, we have:
\[
P = \frac{nRT}{V}
\]
Since both gases have the same pressure \( P \), volume \( V \), and temperature \( T \), they contribute equally to the total pressure when mixed.
After mixing, the total pressure of the mixture is the sum of the partial pressures of each gas:
\[
P_{\text{total}} = P + P = 2P
\]
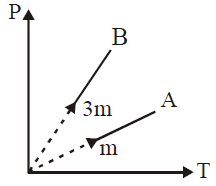
Two different masses m and 3m of an ideal gas are heated separately in a vessel of constant volume, the pressure P and absolute temperature T, graphs for these two cases are shown in the figure as A and B. The ratio of slopes of curves B to A is :
To find the ratio of the slopes of curves \( B \) to \( A \) for gases with masses \( m \) and \( 3m \) at constant volume:
1. For an ideal gas at constant volume, \( P = \frac{nRT}{V} \).
2. Since \( n = \frac{\text{mass}}{\text{molar mass}} \), the pressure \( P \propto \frac{\text{mass} \cdot T}{M} \).
3. So, slope \( \propto \frac{\text{mass}}{M} \) for each gas.
For gas \( A \) with mass \( m \), let the slope be \( S \propto \frac{m}{M} \).
For gas \( B \) with mass \( 3m \), slope \( S_B \propto \frac{3m}{M} \).
Thus, the ratio of slopes \( \frac{S_B}{S_A} = \frac{3m/M}{m/M} = 3:1 \).
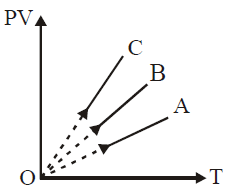
PV versus T graph of equal masses of H2, He and O2 is shown in fig. Choose the correct alternative :
To analyze the \( PV \) versus \( T \) graph for gases of equal mass, we can use the ideal gas law and the fact that for equal masses of different gases, the number of moles \( n \) varies inversely with the molar mass \( M \) of each gas.
1. **Ideal Gas Law**:
\[
PV = nRT
\]
For a given temperature \( T \), \( PV \propto n \). Thus, \( PV \) will be larger for gases with more moles (i.e., smaller molar mass).
2. **Order of Molar Masses**:
- \( H_2 \): Molar mass = 2 g/mol
- \( He \): Molar mass = 4 g/mol
- \( O_2 \): Molar mass = 32 g/mol
Since equal masses are used, the number of moles \( n \) will be highest for \( H_2 \), followed by \( He \), and lowest for \( O_2 \).
3. **Conclusion**:
- Line with the highest \( PV \) value corresponds to the gas with the highest number of moles, i.e., \( H_2 \) (line **C**).
- The middle line corresponds to \( He \) (line **B**).
- The line with the lowest \( PV \) value corresponds to \( O_2 \) (line **A**).
Thus, **C corresponds to \( H_2 \)**, **B to \( He \)**, and **A to \( O_2 \)**.
During an experiment, an ideal gas is found to obey an additional law VP² = constant. The gas is initially at a temperature T and volume V. When it expands to a volume 2V, its temperature will be :
Given that the gas obeys the law \( VP^2 = \text{constant} \).
1. Initially:
\[
VP^2 = k
\]
2. When the volume changes from \( V \) to \( 2V \):
\[
(2V)P'^2 = k
\]
where \( P' \) is the new pressure.
Since \( VP^2 = (2V)P'^2 \), we can relate the pressures as:
\[
P'^2 = \frac{P^2}{2}
\]
\[
P' = \frac{P}{\sqrt{2}}
\]
3. Use the ideal gas law initially and finally:
\[
PV = nRT
\]
\[
P' \cdot 2V = nRT'
\]
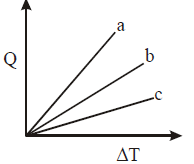
Figure shows the variation in temperature (ΔT) with the amount of heat supplied (Q) in an isobaric process corresponding to a monoatomic (M), diatomic (D) and a polyatomic (P) gas. The initial state of all the gases are the same and the scales for the two axes coincide. Ignoring vibrational degrees of freedom, the lines a, b and c respectively correspond to :
To determine which line corresponds to each type of gas (monoatomic, diatomic, polyatomic), we can use the fact that the specific heat at constant pressure \( C_p \) varies with the degrees of freedom of each gas. Since \( Q = n C_p \Delta T \), for a given \( Q \), the slope of the \( Q \)-\( \Delta T \) line is inversely proportional to \( C_p \).
1. Monoatomic gas (M): \( C_p = \frac{5}{2} R \).
2. Diatomic gas (D): \( C_p = \frac{7}{2} R \).
3. Polyatomic gas (P): \( C_p \) is higher than both monoatomic and diatomic due to additional rotational degrees of freedom.
Since the slope is inversely related to \( C_p \):
- Line with the lowest slope (shallowest) corresponds to the monoatomic gas (M).
- Line with a medium slope corresponds to the diatomic gas (D).
- Line with the steepest slope corresponds to the polyatomic gas (P).
Thus, lines a, b, and c correspond to P, D, and M, respectively.
The following sets of values for Cv and Cp of a gas have been reported by different students. The units are cal/mole-K. Which of these sets is most reliable ?
For an ideal gas, the relationship between \( C_p \) and \( C_v \) is:
\[
C_p - C_v = R
\]
where \( R \approx 2 \, \text{cal/mole-K} \).
Check each option:
1. If \( C_v = 3 \) and \( C_p = 5 \):
\[
C_p - C_v = 5 - 3 = 2 = R
\]
This matches the expected result.
2. Other sets will not satisfy \( C_p - C_v = 2 \) as accurately.
Thus, \( C_v = 3 \) and \( C_p = 5 \) is the most reliable set.