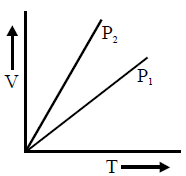
For V versus T curves at constant pressures P1 and P2 for an ideal gas shown in fig. :
Solution:
To analyze the \( V \) versus \( T \) curves for an ideal gas at constant pressures \( P_1 \) and \( P_2 \):
According to Charles's Law:
\[
\frac{V}{T} = \frac{nR}{P}
\]
This implies:
1. At constant pressure, the volume \( V \) is directly proportional to the temperature \( T \), resulting in a straight line.
2. For a given temperature, the volume \( V \) will be greater at a lower pressure \( P \), because \( V \propto \frac{1}{P} \) for a fixed amount of gas.
In the graph:
- The line with a steeper slope corresponds to a lower pressure (since a lower \( P \) results in a larger \( V \) for the same \( T \)).
Since \( P_2 \) has a steeper slope than \( P_1 \), we conclude that:
\[
P_1 > P_2
\]
Therefore, the correct answer is \( P_1 > P_2 \).