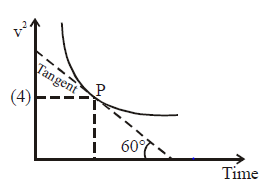
Particle moving along x-axis with variable velocity its (v²) vs. time graph is as shown in the following figure, then the acceleration of particle at point P is :-
No solution provided for this question.
Particle moving along x-axis with variable velocity its (v²) vs. time graph is as shown in the following figure, then the acceleration of particle at point P is :-
No solution provided for this question.
A car moving with a speed of 50 km h–¹ can be stopped by brakes after atleast 6m. If the same car is moving at a speed of 100 km h–¹ the minimum stopping distance is :
The stopping distance is proportional to the square of the speed:
\[
\frac{s_2}{s_1} = \left( \frac{v_2}{v_1} \right)^2
\]
Substituting the values:
\[
\frac{s_2}{6} = \left( \frac{100}{50} \right)^2 = 2^2 = 4
\]
\[
s_2 = 6 \times 4 = 24 \, \text{m}
\]
Thus, the minimum stopping distance at 100 km/h is 24 meters.
The displacement-time graph of a moving particle is as shown in the figure. The instantaneous velocity of the particle is negative at the point :
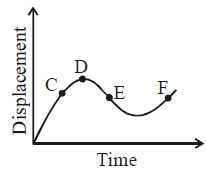
Slope of x-t graph represents velocity. Slope is negative at point E so, velocity is negative for E.
The position-time (x-t) graphs for two children A and B returning from their school O to their homes P and Q respectively are as shown in the figure. Choose the incorrect statement regarding these graphs :
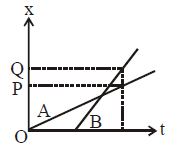
Slope of x-t graph represents velocity. slope is more for B so it will have higher velocity