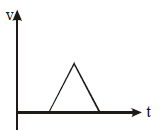
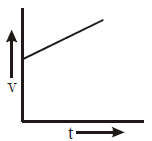
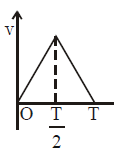
The given graph shows the variation of velocity with which one of the graph given below correctly represents the variation of acceleration with displacement :
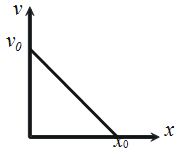
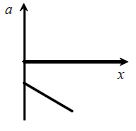
The given graph shows the variation of velocity with which one of the graph given below correctly represents the variation of acceleration with displacement :
The displacement-time graph of two moving particles A and B respectively make angles of 30° and 45° with the x-axis respectively. The ratio of their velocities is
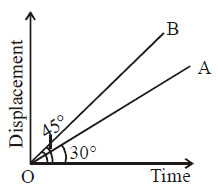
Slope of displacement time graph represents velocity.
VA= tan 30 0
VB= tan 45 0
So, VA/VB=tan 30 0/tan 45 0= 1/√3
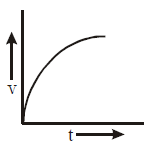
A body is travelling in a straight line with a uniformly increasing speed. Which one of the plot represents the change in distance (s) travelled with time (t)?
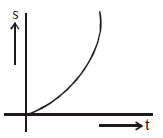
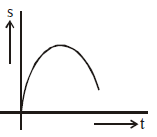
\[ s= \frac{1}{2}at^{2}\]
As s is proportional to square of t. s-t graph is a parabola.
A particle is thrown upwards, then correct v-t graph will be
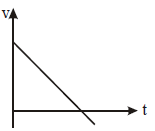
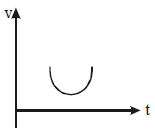
Slope of v-t graph represent acceleration. when object is thrown upward its acceleration is -g for the entire journey. So, slope is -g.
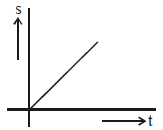
A body starts from rest and moves with uniform acceleration. Which of the following graphs represents it motion?
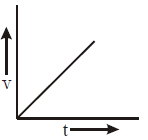
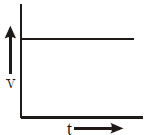
\[ v = u + at ; as, u = 0 ; v = at\]
As, v is proportional to t ; graph of v-t is a straight line.
If the figure below represents a parabola, identify the physical quantities representing Y and X for constant acceleration
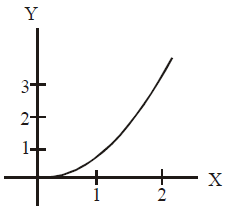
\[ S= \frac{1}{2}at^{2}\]
As, S is proportional to t graph is a parabola
The v-t graph for a particle is as shown. The distance travelled in the first four second is
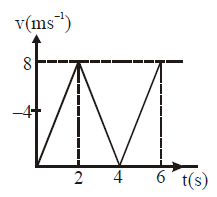
Area bounded by v-t graph represents displacement. Here.
Area = (1/2)×4×8= 16
So, Distance travelled is 16 m.
A particle starts form rest. Its acceleration (a) versus time (t) is as shown in the figure. The maximum speed of the particle will be
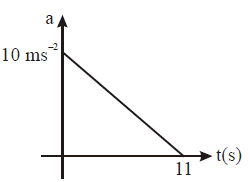
Area of acceleration time graph represents change in velocity. As acceleration is always positive speed is always increasing.
Area = (1/2)× 10× 11 = 55
So, max. speed of 55 m/s
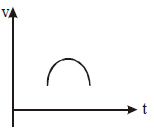
A particle is thrown vertically upwards with a velocity ν. It returns to the ground in time T. Which of the following graphs correctly represents the motion?
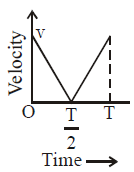
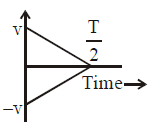
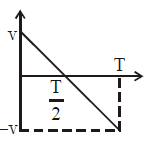
Graph of velocity time graph represents acceleration. During the entire journey acceleration is -g. so slope is negative.
A rocket is fired upwards. Its velocity versus time graph is shown in figure. The maximum height reached by the rocket is :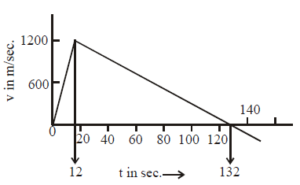
No solution provided for this question.