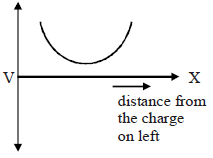
Which graph show the correct variation of potential between two negative point charges along x-axis separated by finite distance
Solution:
The graph shown correctly represents the variation of electric potential along the x-axis between two negative charges.
Explanation:
1. Electric Potential Due to a Point Charge:
- For a single negative charge, the potential is negative and becomes less negative (closer to zero) as the distance from the charge increases.
2. Superposition of Potentials:
- The net potential at any point is the sum of potentials due to both charges.
- Near each charge, the potential is dominated by that charge and highly negative.
- At a point midway between the two charges, the potentials due to both charges add up (both are negative), giving the minimum (most negative) potential.
3. Shape of the Graph:

- The potential decreases sharply near each charge.
- Between the charges, the potential reaches a minimum (most negative value) due to the additive contributions of both charges.
The graph accurately shows this behavior with a dip between the two charges.