The pressure and temperature of two different gases is P and T having the volume V for each. They are mixed keeping the same volume and temperature, the pressure of the mixture will be :
Since the gases are mixed at constant volume \( V \) and temperature \( T \), we can apply the ideal gas law for each gas:
For each gas, we have:
\[
P = \frac{nRT}{V}
\]
Since both gases have the same pressure \( P \), volume \( V \), and temperature \( T \), they contribute equally to the total pressure when mixed.
After mixing, the total pressure of the mixture is the sum of the partial pressures of each gas:
\[
P_{\text{total}} = P + P = 2P
\]
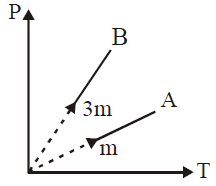
Two different masses m and 3m of an ideal gas are heated separately in a vessel of constant volume, the pressure P and absolute temperature T, graphs for these two cases are shown in the figure as A and B. The ratio of slopes of curves B to A is :
To find the ratio of the slopes of curves \( B \) to \( A \) for gases with masses \( m \) and \( 3m \) at constant volume:
1. For an ideal gas at constant volume, \( P = \frac{nRT}{V} \).
2. Since \( n = \frac{\text{mass}}{\text{molar mass}} \), the pressure \( P \propto \frac{\text{mass} \cdot T}{M} \).
3. So, slope \( \propto \frac{\text{mass}}{M} \) for each gas.
For gas \( A \) with mass \( m \), let the slope be \( S \propto \frac{m}{M} \).
For gas \( B \) with mass \( 3m \), slope \( S_B \propto \frac{3m}{M} \).
Thus, the ratio of slopes \( \frac{S_B}{S_A} = \frac{3m/M}{m/M} = 3:1 \).
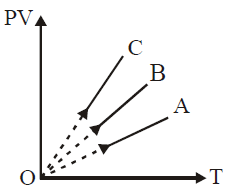
PV versus T graph of equal masses of H2, He and O2 is shown in fig. Choose the correct alternative :
To analyze the \( PV \) versus \( T \) graph for gases of equal mass, we can use the ideal gas law and the fact that for equal masses of different gases, the number of moles \( n \) varies inversely with the molar mass \( M \) of each gas.
1. **Ideal Gas Law**:
\[
PV = nRT
\]
For a given temperature \( T \), \( PV \propto n \). Thus, \( PV \) will be larger for gases with more moles (i.e., smaller molar mass).
2. **Order of Molar Masses**:
- \( H_2 \): Molar mass = 2 g/mol
- \( He \): Molar mass = 4 g/mol
- \( O_2 \): Molar mass = 32 g/mol
Since equal masses are used, the number of moles \( n \) will be highest for \( H_2 \), followed by \( He \), and lowest for \( O_2 \).
3. **Conclusion**:
- Line with the highest \( PV \) value corresponds to the gas with the highest number of moles, i.e., \( H_2 \) (line **C**).
- The middle line corresponds to \( He \) (line **B**).
- The line with the lowest \( PV \) value corresponds to \( O_2 \) (line **A**).
Thus, **C corresponds to \( H_2 \)**, **B to \( He \)**, and **A to \( O_2 \)**.
During an experiment, an ideal gas is found to obey an additional law VP² = constant. The gas is initially at a temperature T and volume V. When it expands to a volume 2V, its temperature will be :
Given that the gas obeys the law \( VP^2 = \text{constant} \).
1. Initially:
\[
VP^2 = k
\]
2. When the volume changes from \( V \) to \( 2V \):
\[
(2V)P'^2 = k
\]
where \( P' \) is the new pressure.
Since \( VP^2 = (2V)P'^2 \), we can relate the pressures as:
\[
P'^2 = \frac{P^2}{2}
\]
\[
P' = \frac{P}{\sqrt{2}}
\]
3. Use the ideal gas law initially and finally:
\[
PV = nRT
\]
\[
P' \cdot 2V = nRT'
\]
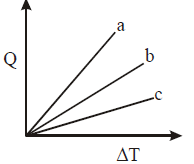
Figure shows the variation in temperature (ΔT) with the amount of heat supplied (Q) in an isobaric process corresponding to a monoatomic (M), diatomic (D) and a polyatomic (P) gas. The initial state of all the gases are the same and the scales for the two axes coincide. Ignoring vibrational degrees of freedom, the lines a, b and c respectively correspond to :
To determine which line corresponds to each type of gas (monoatomic, diatomic, polyatomic), we can use the fact that the specific heat at constant pressure \( C_p \) varies with the degrees of freedom of each gas. Since \( Q = n C_p \Delta T \), for a given \( Q \), the slope of the \( Q \)-\( \Delta T \) line is inversely proportional to \( C_p \).
1. Monoatomic gas (M): \( C_p = \frac{5}{2} R \).
2. Diatomic gas (D): \( C_p = \frac{7}{2} R \).
3. Polyatomic gas (P): \( C_p \) is higher than both monoatomic and diatomic due to additional rotational degrees of freedom.
Since the slope is inversely related to \( C_p \):
- Line with the lowest slope (shallowest) corresponds to the monoatomic gas (M).
- Line with a medium slope corresponds to the diatomic gas (D).
- Line with the steepest slope corresponds to the polyatomic gas (P).
Thus, lines a, b, and c correspond to P, D, and M, respectively.
The following sets of values for Cv and Cp of a gas have been reported by different students. The units are cal/mole-K. Which of these sets is most reliable ?
For an ideal gas, the relationship between \( C_p \) and \( C_v \) is:
\[
C_p - C_v = R
\]
where \( R \approx 2 \, \text{cal/mole-K} \).
Check each option:
1. If \( C_v = 3 \) and \( C_p = 5 \):
\[
C_p - C_v = 5 - 3 = 2 = R
\]
This matches the expected result.
2. Other sets will not satisfy \( C_p - C_v = 2 \) as accurately.
Thus, \( C_v = 3 \) and \( C_p = 5 \) is the most reliable set.
A cylinder of capacity 20 litres is filled with H2 gas. The total average kinetic energy of translatory motion of its molecules is \( 1.5\times 10^{5}\) J. The pressure of hydrogen in the cylinder is
The total average kinetic energy \( E \) of translatory motion for an ideal gas is given by:
\[
E = \frac{3}{2} nRT
\]
where:
- \( n \) is the number of moles,
- \( R \) is the gas constant (\( 8.314 \, \text{J/mol·K} \)),
- \( T \) is the temperature in Kelvin.
We can rearrange to find \( nRT \):
\[
nRT = \frac{2}{3} E
\]
The ideal gas law also gives us:
\[
PV = nRT
\]
Thus,
\[
P = \frac{nRT}{V} = \frac{\frac{2}{3} E}{V}
\]
Substitute \( E = 1.5 \times 10^5 \, \text{J} \) and \( V = 20 \, \text{litres} = 20 \times 10^{-3} \, \text{m}^3 \):
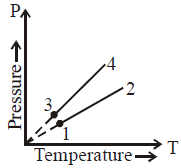
Pressure versus temperature graph of an ideal gas of equal number of moles (μ) of different volumes are plotted as shown in figure. Choose the correct alternative :
Thank you for the clarification. Given the correct answer, let's interpret the graph accordingly.
In this pressure (\( P \)) vs. temperature (\( T \)) graph:
1. **Parallel Lines**: When two lines have the same slope, it implies they have the same volume. This is because the slope in a \( P \)-\( T \) graph (for constant \( V \)) is given by \( \frac{nR}{V} \).
- Since lines **1** and **2** are parallel, we have \( V_1 = V_2 \).
- Similarly, lines **3** and **4** are parallel, so \( V_3 = V_4 \).
2. **Comparing Slopes**: The line with a steeper slope corresponds to a smaller volume, and the line with a shallower slope corresponds to a larger volume.
- Since lines 1 and 2 have a shallower slope compared to lines 3 and 4, we conclude that \( V_1 = V_2 > V_3 = V_4 \).
Final Answer:
- \( V_1 = V_2 \), \( V_3 = V_4 \), and \( V_2 > V_3 \).