Topic: Modern Physics
Subtopic: Photoelectric Effects and deBroglie Equation
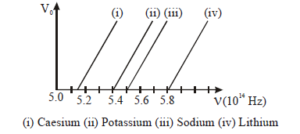
The figure shows different graphs between stopping potential (V0) and frequency (n) for photosensitive surface of caesium, potassium, sodium and lithium. The plots are parallel. Correct ranking of the targets according to their work function, greatest first, will be :
(i) > (ii) > (iii) > (iv)
(i) > (iii) > (ii) > (iv)
(iv) > (iii) > (ii) > (i)
(i) = (iii) > (ii) = (iv)
No solution provided for this question.
Leave a Reply