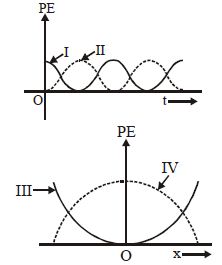
For a particle executing simple harmonic motion, the displacement x is given by x = A cosωt. Identify the graph which represents the variation of potential energy (PE) as function of time t and displacement x
Solution:
\[ P.E = \frac{1}{2}Kx^{2} = \frac{1}{2}KA^{2}cos^{2}\left( \omega t \right) \]
Graph I represents graph of cos²ωt.
\[ P.E = \frac{1}{2}Kx^{2} \]
Graph III represents a parabolic function