Solution:
Thank you for the clarification. Given the correct answer, let's interpret the graph accordingly.
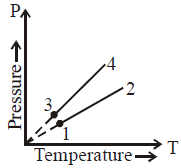
In this pressure (\( P \)) vs. temperature (\( T \)) graph:
1. **Parallel Lines**: When two lines have the same slope, it implies they have the same volume. This is because the slope in a \( P \)-\( T \) graph (for constant \( V \)) is given by \( \frac{nR}{V} \).
- Since lines **1** and **2** are parallel, we have \( V_1 = V_2 \).
- Similarly, lines **3** and **4** are parallel, so \( V_3 = V_4 \).
2. **Comparing Slopes**: The line with a steeper slope corresponds to a smaller volume, and the line with a shallower slope corresponds to a larger volume.
- Since lines 1 and 2 have a shallower slope compared to lines 3 and 4, we conclude that \( V_1 = V_2 > V_3 = V_4 \).
Final Answer:
- \( V_1 = V_2 \), \( V_3 = V_4 \), and \( V_2 > V_3 \).
Leave a Reply