Solution:
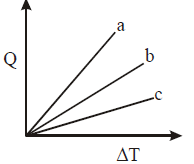
To determine which line corresponds to each type of gas (monoatomic, diatomic, polyatomic), we can use the fact that the specific heat at constant pressure \( C_p \) varies with the degrees of freedom of each gas. Since \( Q = n C_p \Delta T \), for a given \( Q \), the slope of the \( Q \)-\( \Delta T \) line is inversely proportional to \( C_p \).
1. Monoatomic gas (M): \( C_p = \frac{5}{2} R \).
2. Diatomic gas (D): \( C_p = \frac{7}{2} R \).
3. Polyatomic gas (P): \( C_p \) is higher than both monoatomic and diatomic due to additional rotational degrees of freedom.
Since the slope is inversely related to \( C_p \):
- Line with the lowest slope (shallowest) corresponds to the monoatomic gas (M).
- Line with a medium slope corresponds to the diatomic gas (D).
- Line with the steepest slope corresponds to the polyatomic gas (P).
Thus, lines a, b, and c correspond to P, D, and M, respectively.
Leave a Reply