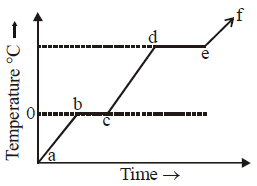
 Which part of the above plot represent a phase change ?
Solution:
In Part b to c temperature remains constant even when heat is supplied
Similarly in part d to e temperature remains constant
So state is changing in part b to c and in d to e.
Which part of the above plot represent a phase change ?In Part b to c temperature remains constant even when heat is supplied
Similarly in part d to e temperature remains constant
So state is changing in part b to c and in d to e.
Leave a Reply