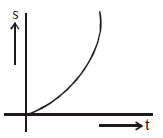
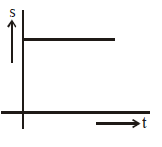
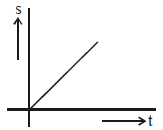
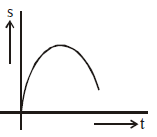
A body is travelling in a straight line with a uniformly increasing speed. Which one of the plot represents the change in distance (s) travelled with time (t)?
Solution:
\[ s= \frac{1}{2}at^{2}\]
As s is proportional to square of t. s-t graph is a parabola.
Leave a Reply