Solution:
The figure represents the electric field (E) along the \(x\)-axis due to a dipole consisting of a positive charge (\(+q\)) at \(x = -a\) and a negative charge (\(-q\)) at \(x = +a\).
The electric field due to such a dipole varies as follows:
1. Near \(x = -a\): The field is dominated by the positive charge, so it points away from \(x = -a\).
2. Near \(x = +a\): The field is dominated by the negative charge, so it points toward \(x = +a\).
3. Between \(x = -a\) and \(x = +a\): The contributions from both charges partially cancel out, leading to a local minimum in the field magnitude.
4. Far from the charges (\(|x| \gg a\)): The field behaves approximately as a dipole field, decreasing as \(1/x^3\).
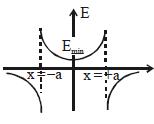
The attached graph correctly shows these features:
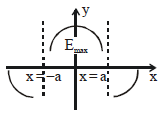
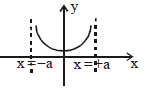
- A local minimum in \(E\) between \(x = -a\) and \(x = +a\), at the midpoint where the dipole effect is weakest.
- The field magnitude diverges near \(x = -a\) and \(x = +a\) due to the proximity to the charges.
- Symmetry around the origin is preserved, as the system is symmetric about \(x = 0\).
Leave a Reply