Topic: Current Electricity
Subtopic: Variation of Resistance with Temperature
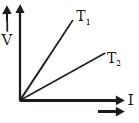
The voltage V and current I graph for a conductor at two different temperatures T1 and T2 are shown in the figure. The relation between T1 and T2 is :-
Solution:
Slope of V-I graph represents Resistance. So R1>R2
Leave a Reply