Solution:
For an ideal gas, at constant volume, the pressure \( P \) is directly proportional to the temperature \( T \) (Gay-Lussac's Law):
\[
P \propto T
\]
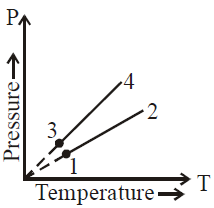
In the graph, each line represents a pressure-temperature relationship at different volumes. A steeper slope indicates a smaller volume (since \( P = \frac{nRT}{V} \) and a higher \( V \) gives a less steep line).
From the figure:
1. Lines \( 1 \) and \( 2 \) have the same slope, indicating \( V_1 = V_2 \).
2. Lines \( 3 \) and \( 4 \) also have the same slope, indicating \( V_3 = V_4 \).
3. The slope of lines \( 3 \) and \( 4 \) is steeper than that of lines \( 1 \) and \( 2 \), meaning \( V_2 > V_3 \).
Thus, the correct answer is \( V_1 = V_2 \), \( V_3 = V_4 \), and \( V_2 > V_3 \).
Leave a Reply