Solution:
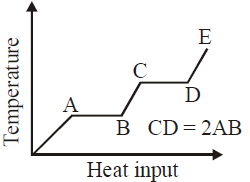
In the provided graph, the temperature of the material increases with heat input. The flat portions of the graph (AB and CD) represent phase changes where heat is absorbed but the temperature remains constant. Specifically:
- Segment AB corresponds to the latent heat of fusion (solid to liquid).
- Segment CD corresponds to the latent heat of vaporization (liquid to gas).
The length of CD is given as twice the length of AB, meaning the heat input required for vaporization is twice that of fusion.
However, the false conclusion stated in the answer is that "the latent heat of fusion is twice the latent heat of vaporization." This contradicts the graph because CD represents vaporization and is twice the length of AB, implying that the latent heat of vaporization is actually twice the latent heat of fusion, not the other way around.
Hence, the false conclusion is that the latent heat of fusion is larger than the latent heat of vaporization. The correct interpretation from the graph is that the latent heat of vaporization is twice the latent heat of fusion.
Leave a Reply