Solution:
Given the graph and your observation, we can analyze whether the specific heat capacity is greater in the liquid state than in the solid state.
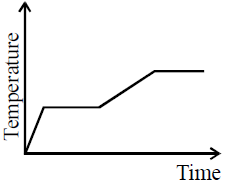
In a temperature vs. time graph, under uniform heat supply, the slope of the graph during the temperature rise is inversely proportional to the specific heat capacity (\(C\)). Mathematically, for a given heat input rate:
\[
\text{Rate of temperature increase} \propto \frac{1}{C}
\]
- Solid phase: In the first sloped section (just before the first horizontal plateau), the slope is steeper, indicating a faster temperature increase. This implies that the specific heat capacity of the substance in the solid state is lower.
- Liquid phase: After the first plateau (phase change), the slope in the second sloped section (where the substance is in the liquid state) is less steep, indicating a slower temperature increase. This suggests that more heat is required to raise the temperature in this phase, which means the specific heat capacity is higher in the liquid state.
.
Leave a Reply