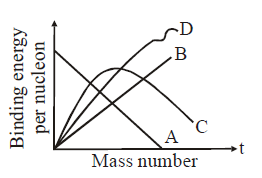
Binding energy per nucleon plot against the mass number for stable nuclei is shown in the figure. Which curve is correct : ABCDNo solution provided for this question.
Leave a Reply