

Solution:
The graph in the uploaded image is correct. Here's the explanation with equations:
For a spherical shell of radius \( R \) with charge \( Q \), the electric field \( E(r) \) is given by:
1. Inside the shell (\( 0 \leq r < R \)):
By Gauss's law, the electric field inside a spherical shell is zero:
\[
E(r) = 0, \quad \text{for } r < R
\]
2. On or outside the shell (\( r \geq R \)):
The shell behaves like a point charge located at its center. The electric field at a distance \( r \) is:
\[
E(r) = \frac{1}{4 \pi \epsilon_0} \cdot \frac{Q}{r^2}, \quad \text{for } r \geq R
\]
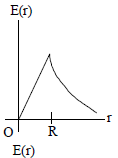
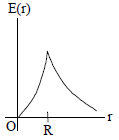
Graph Representation:
- For \( r < R \), \( E(r) = 0 \), so the graph is flat (on the \( x \)-axis).
- For \( r \geq R \), \( E(r) \propto \frac{1}{r^2} \), so the graph decreases as \( r \) increases, starting from a maximum value at \( r = R \).
Leave a Reply